The Ishikawa diagram, also known as the Cause and Effect diagram or Fishbone diagram, is a tool used to identify and analyze the causes of problems in an organization or business. The name of the tool comes from the Japanese scientist Kaoru Ishikawa, who introduced it in the 1960s. The Ishikawa diagram is widely used in both industry and services to conduct a thorough analysis of problem causes and find effective solutions.
Why should you be interested in this?
Regardless of the type of activity, a company will always face various problems that can affect efficiency and productivity. Therefore, anyone responsible for managing and improving business processes must be well-prepared to identify and solve problems in order to achieve success. In this context, the Ishikawa diagram is an extremely useful tool that can help the reader identify the sources of problems and develop appropriate solutions.
The Ishikawa diagram – an effective tool for identifying the causes of problems
By analyzing various factors that influence a specific problem, this diagram allows for the discovery of hidden or underestimated causes that may lead to the occurrence of problems. With this tool, doubts can be dispelled, and it becomes possible to understand why a particular problem occurs and what its main causes are. The Ishikawa diagram also enables a cause-and-effect analysis to identify how different factors affect a given problem and what the interconnections between them are. Through such an analysis, a specific action plan can be developed to solve the problem at hand.
What is an Ishikawa diagram?
The Ishikawa diagram is a tool used in quality management, aiming to identify and analyze the causes of problems or non-conformities in business processes. It is a graphical method of presenting information that allows to see the relationship between different factors affecting a given situation.
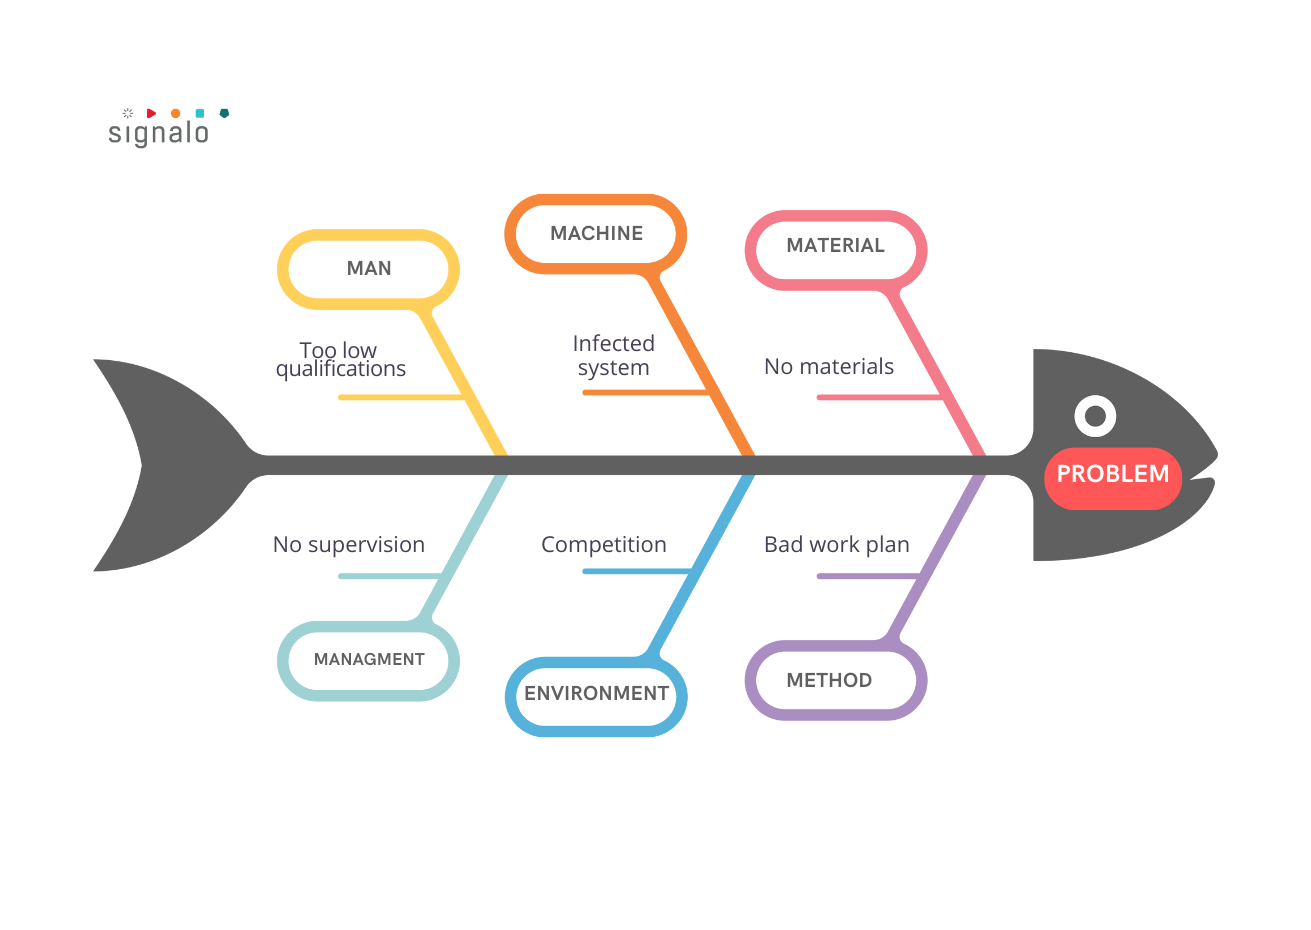
The Ishikawa diagram consists of a main axis, on which the main categories influencing the problem are presented. These categories are usually: people, processes, machines, materials, environment, and methods. Each of these categories can be further divided into subcategories, and then into secondary causes.
Ishikawa Diagram – History
The Ishikawa diagram was developed by the Japanese engineer and economist Karou Ishikawa in the 1960s. Ishikawa was one of the leaders in the field of quality management and was the first to introduce this diagram into business practice. His goal was to increase production efficiency and eliminate errors and non-conformities in production processes.
Elements of the Ishikawa Diagram:
The problem or discrepancy that needs to be identified and analyzed is the main axis of the Ishikawa diagram. On this axis, we write a description or name of the problem.
• Then, we draw arrows from the main axis to represent the main categories that influence the given problem, such as people, processes, machines, materials, environment, and methods.
• Under each of these categories, we can include subcategories that provide detailed descriptions of the aspects that affect the problem. For example, under the category of “people,” we can list subcategories related to employee training, competencies, or motivation.
• The Ishikawa diagram also includes secondary causes, which are specific causes of the problem indicated at the ends of the arrows. We should identify and control these concrete factors in order to solve the problem.
• The Ishikawa diagram is a tool that helps us identify the causes of a problem, enabling us to take effective analysis and corrective actions. It is often used in quality management and process improvement in various industries and sectors of the economy.
Applications of the Ishikawa diagram
The Ishikawa diagram can be effectively used in various industries and situations. Its versatility makes it popular in both manufacturing, services, and healthcare sectors.
MANUFACTURING
In manufacturing, the Ishikawa diagram is often used to identify the causes of problems such as product defects, machine failures, production process delays, etc. With the help of the diagram, employees can accurately understand which factors contribute to these problems and focus on eliminating them.
SERVICES
In the service sector, the Ishikawa diagram can help identify the causes of customer dissatisfaction, delivery delays, service errors, etc. This tool can help identify the root causes of problems and make appropriate changes to improve service quality.
HEALTHCARE
In the field of healthcare, the Ishikawa diagram can be used to analyze the causes of medical errors, work organization issues, inadequate communication between teams, etc. Utilizing this tool can assist medical institutions in improving processes and minimizing the risk of errors.
Examples of specific applications
• In a car factory, an increase in the number of complaints regarding the quality of body painting was observed. The decision was made to use an Ishikawa diagram to identify the causes of this problem. After analysis, it was found that the main causes were improper preparation of the body surface before painting, the quality of the paint used, and improperly adjusted parameters in the painting process.
• A courier service company noticed an increase in customer complaints about delivery delays. After using an Ishikawa diagram, it was discovered that the main causes were improperly planned delivery routes, time management issues, and inadequate training for drivers.
• A hospital identified an increase in the number of hospital-acquired infections. Using an Ishikawa diagram, it was determined that the main causes were a lack of appropriate staff support in maintaining hygiene, inaccuracies in performing medical procedures, and improper use of disinfection devices.
In each of these situations, the Ishikawa diagram was used to identify the causes of the problems and take appropriate corrective actions. By using this tool, organizations were able to focus on eliminating the root causes of the problems, leading to improved quality and operational effectiveness.
Benefits of using an Ishikawa diagram
Increased problem-solving efficiency
• The Ishikawa diagram allows for the identification of all possible causes of a problem and analyzing their impact on the final results. This enables focusing on the most important areas of action and taking appropriate corrective actions.
• It also enables the involvement of the entire team in the problem-solving process. Through collaborative creation of the diagram, each team member has the opportunity to express their point of view and contribute their knowledge and experience to the discussion. This leads to a more comprehensive analysis of the problem and better results.
Visual representation of complex relationships
• The ability to visually represent complex relationships between causes and effects. This makes it easier to understand and identify dependencies between different factors impacting the problem.
• The Ishikawa diagram allows for grouping causes into categories, which facilitates analysis and action planning. Categories such as people, processes, machines, materials, etc. can be distinguished. This helps to better understand the complexity of problems and focus on specific areas for improvement.
How does the diagram help identify the main causes of problems?
Identification of root causes
• The Ishikawa diagram allows for the identification of the root causes of a problem. By using this method, all potential causes that may affect the outcome can be examined. This enables focusing on eliminating the causes rather than just addressing the effects.
• To determine the main causes of a problem, the “5 Whys” technique is often used. It involves asking “why” in response to each cause to reach the source of the problem. The Ishikawa diagram is an excellent tool for visualizing this process and facilitating the identification of primary root causes.
Cause and Effect Analysis
The Ishikawa diagram also allows for the analysis of cause and effect. This helps to evaluate the effects that individual causes have on the entire system. This allows for a better understanding of which causes should receive the most attention and what actions should be taken to optimize the process.
Problem-solving possibilities with data from the diagram
Creating an action plan
• Based on the data collected using the Ishikawa diagram, an action plan can be created to solve the problem. The analysis of causes is helpful in identifying areas for improvement and determining priorities.
• The action plan may include changes in processes, training for employees, purchasing new equipment or materials, etc. All these actions should be well thought out and based on facts gathered using the diagram.
Monitoring progress and evaluating effectiveness
• After implementing the action plan, the Ishikawa diagram can also be used to monitor progress and evaluate the effectiveness of the actions taken. Comparing results before and after implementing changes allows for an assessment of whether the corrective actions have produced the desired outcomes.
• If the problem has not been fully resolved, the Ishikawa diagram can also be used to search for additional causes and continue the process of improvement.
In short – Step by step – How to create an Ishikawa diagram?
• Problem analysis – identifying the problem to be solved
• Identification of subcategories – determining the main areas that may contribute to the occurrence of the problem
• Searching for secondary causes – detecting smaller factors that influence the problem
• Assigning causes – identifying specific causes for each subcategory
• Mapping relationships – determining the dependencies between causes and the end outcome
Summary and conclusions
The main purpose of creating an Ishikawa diagram is to understand the main causes of the problem, not just its symptoms. It is used to show various factors that may affect the problem. The main advantage of this tool is that it enables a systematic and comprehensive analysis of the problem, using a cause-and-effect approach.
Why is it worth it?
The use of an Ishikawa diagram brings tangible benefits:
• Firstly, it allows for the identification of many possible causes of a problem that may not be visible at first glance. This helps avoid symptomatic treatment by focusing on eliminating the root of the problem.
• Another advantage of the Ishikawa diagram is that it enables grouping of causes into different categories. This makes it easy to identify dominant factors influencing the problem and focus on them during analysis and problem-solving.
• The Ishikawa diagram is also very useful when the problem involves multiple variables or processes. It allows for visualizing complex cause-and-effect relationships and facilitates the identification of potential sources of the problem.
Many applications
Creating an Ishikawa diagram has applications in many fields, not just quality management. It can be used in areas such as production, services, logistics, and even in fields like medicine or education.
Furthermore, creating an Ishikawa diagram is also a tool for process improvement. It allows for the identification of areas where problems occur and leads to implementing changes aimed at increasing efficiency and process quality.
Support from Signalo
In the face of growing challenges related to identifying and optimizing their processes, it is worth reaching for tools that allow for the identification and optimization of processes in companies.
Why is it worth it?
Thanks to our solutions, companies can increase the efficiency of their operations, better utilize resources, and reduce costs. Our innovative technologies are the perfect support for organizations from various sectors of the market, regardless of their size or specialization.